
One of the existential questions that have always bothered marketers is finding the magic bullet KPI that could measure the whole value of ROI in marketing communications.
In pre-digital times one such metric that all brands, and especially those in the FMCG sector, used to propagate, was share of voice (SOV). In offline communications, it is traditionally used to measure the proportion of the total ad-spend within a given market that each player in that market has made.
The application of SOV in the digital and post-digital era, however, has been quite a problematic but invariable part of most marketing measurement programs. SOV was now adapted to refer to the part of conversations a brand generated on social media during a given period.
In his recent article “Measure Share of Engagement Instead of Share of Voice”, Christopher Penn (@cspenn) critiques the application of SOV, explaining how easy it is to fake it, and urges brands to measure share of engagement instead.
Engagement is certainly a nebulous concept and different marketers may refer to a whole range of different activities when using the term ‘engagement’.
In social media terms, however, we generally use engagement to refer to the measurement of interactions users have with a social object. From social network theory, we know that all social networks revolve around social objects, which can be stories, photos, videos, products, events, etc.
In the context of the world’s largest social network – Facebook – even comments and re-shares can act as social objects, as Facebook users can post and re-post comments, and even comments about a comment of somebody else.
Now back to the question about the magic bullet KPI.
Even though social media KPIs are platform- and industry-specific, share of engagement on Facebook might well be that magic bullet KPI for at least three reasons:
- Facebook is the largest social media network in the world with more than 1.6 billion members;
- No brand can develop an effective social media strategy if it is not present on Facebook;
- Benchmarking share of engagement against competitors and following its trend over time is a reliable indicator of the success of a brand’s social media strategy, and although not directly related to business results, it is far more connected to helping brands achieve their objectives than just looking at volume-base metrics such as ‘likes’.
Realistically, if your brand is targeting the right audience and its share of engagement is increasing, it is definitely in a strong position!
And here comes the tricky part.
Calculating share of engagement by drawing only on Facebook brand pages gives a totally inaccurate and incomplete picture of how your brand is faring on the social arena, as the majority of conversations around your brand happen in private elsewhere on Facebook.
In this regard, not many brands know that these private conversations can now be accessed in an aggregated and anonymized fashion through Facebook topic data.
Let’s look at the following example based on Facebook topic data, which was part of a study on luxury brands in social media we recently did at Commetric. It shows the share of engagement of five luxury fashion brands on Facebook: Louis Vuitton, Prada, Gucci, Burberry and Chanel, in the period 15 June-15 July 2016.
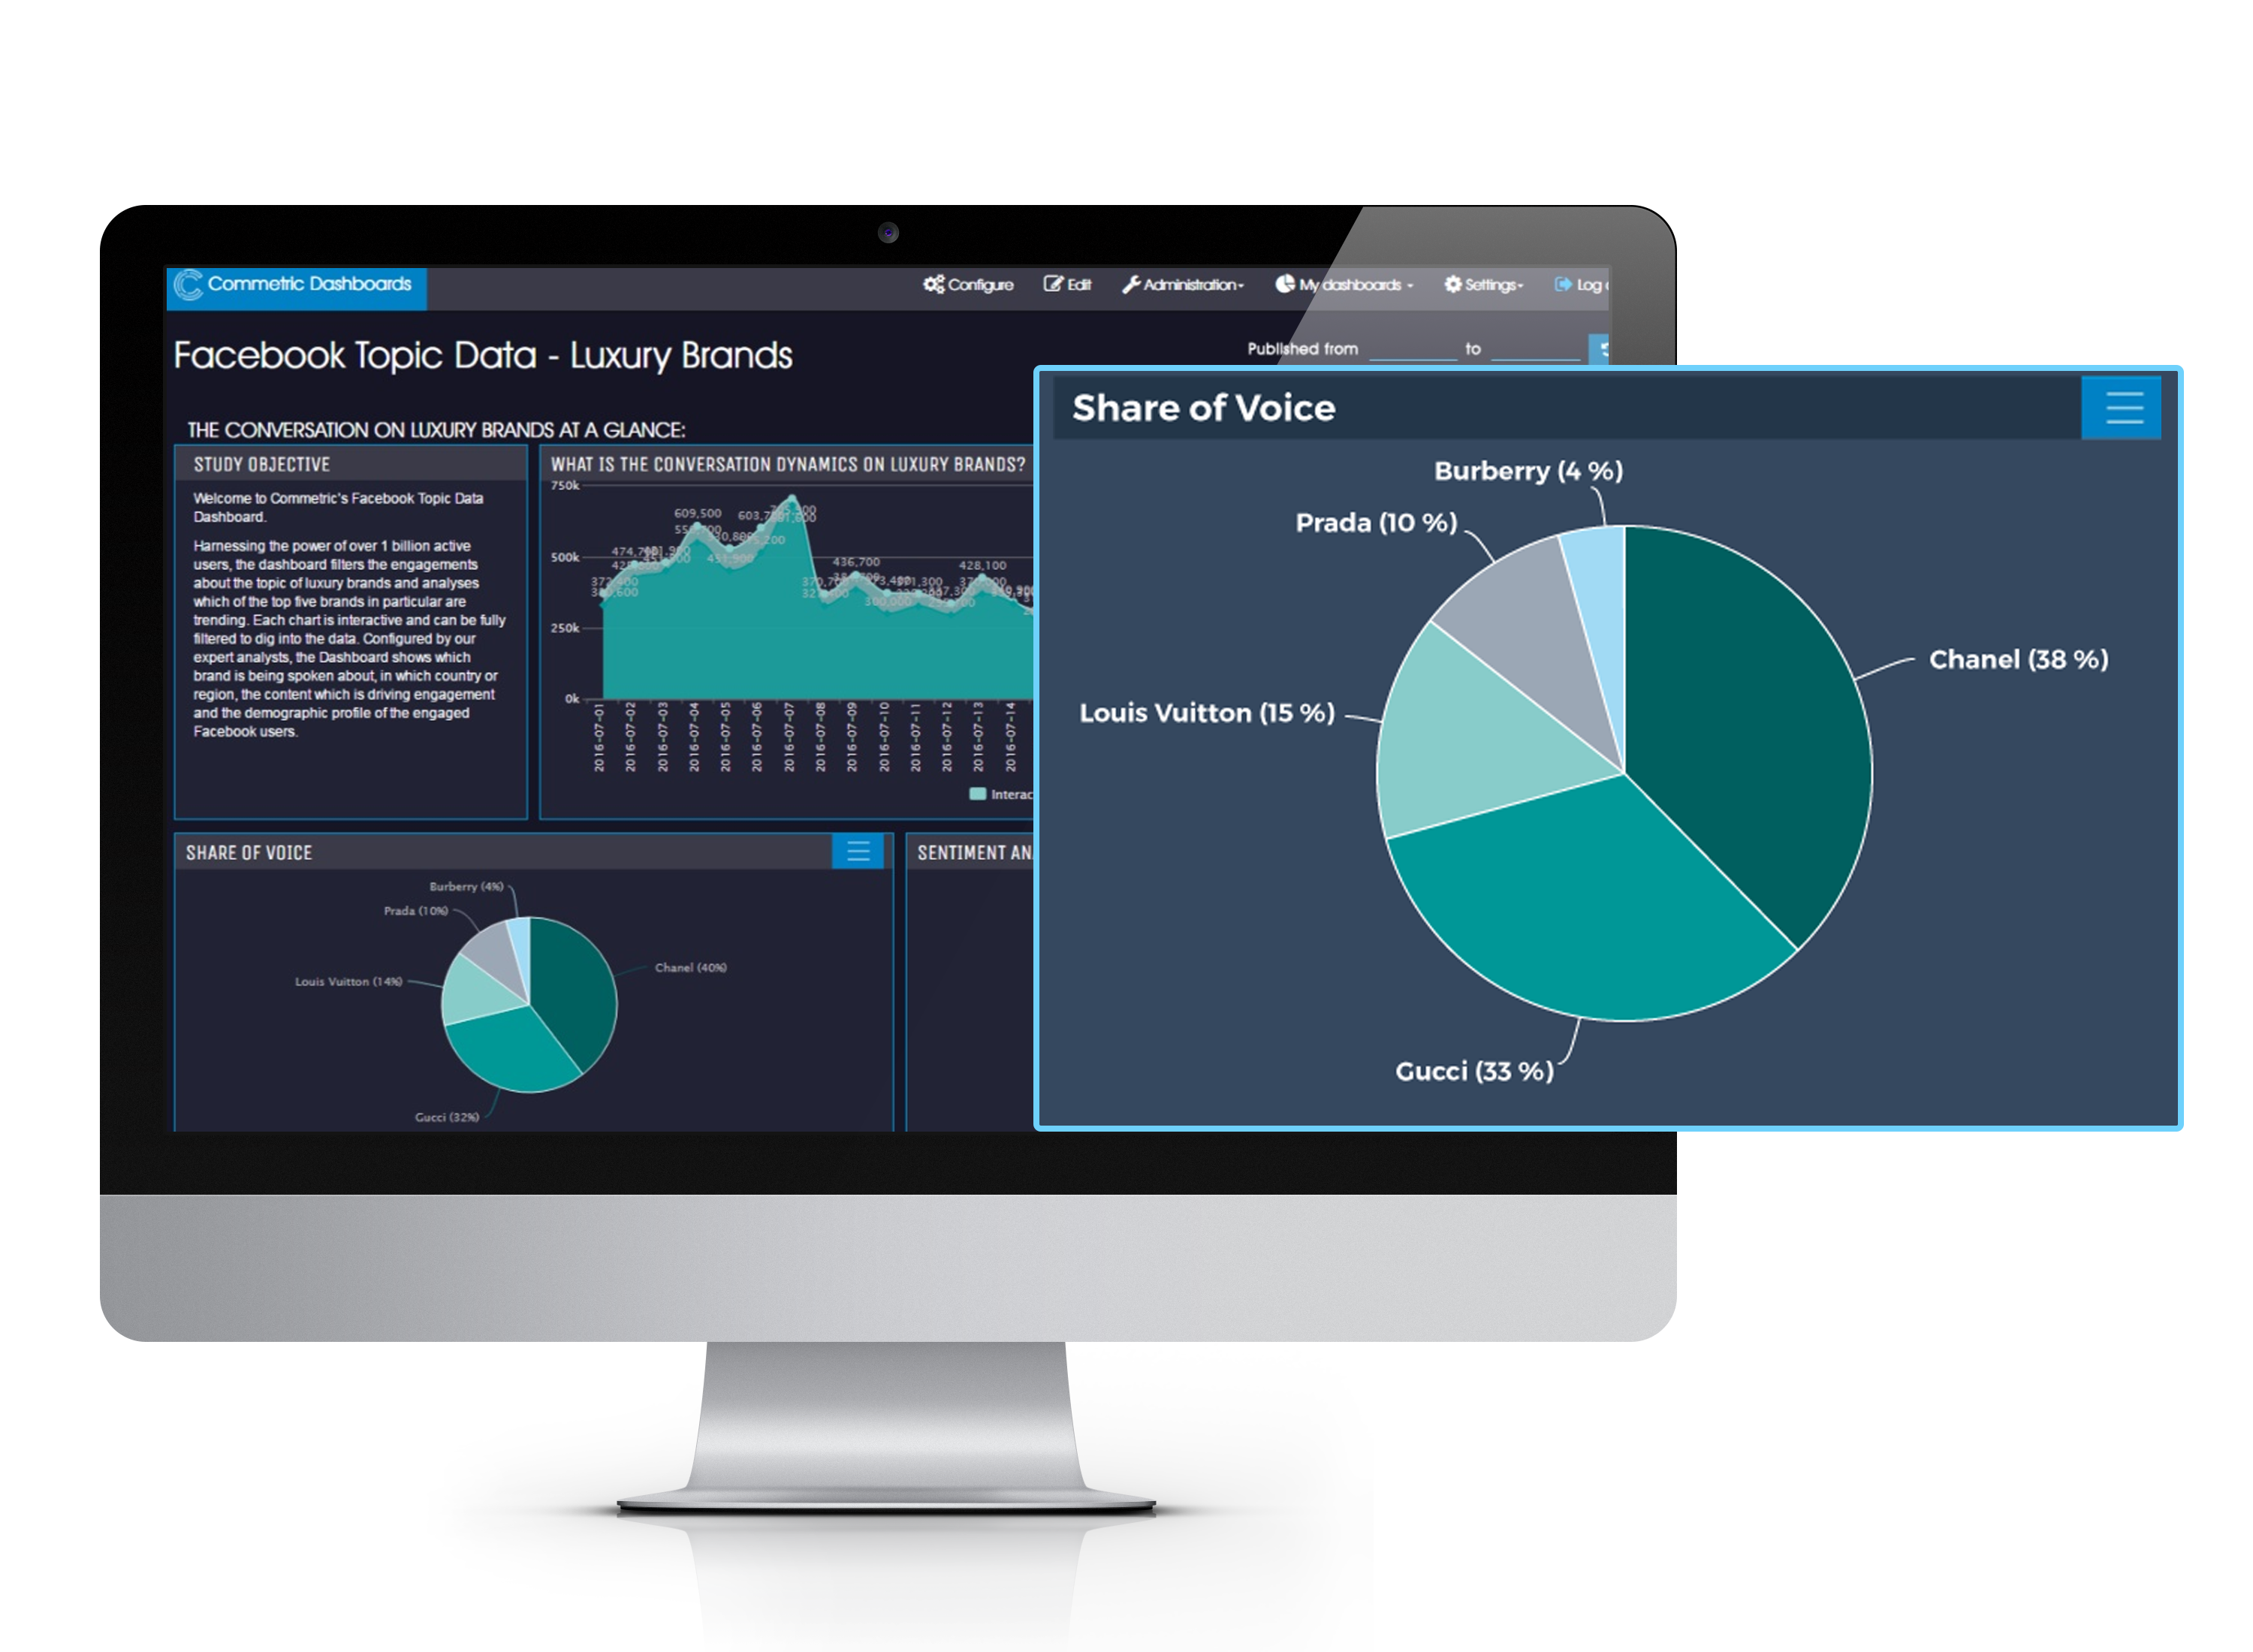
The chart above covers ALL interactions on Facebook (and not just on brand pages) mentioning one of these five brands in the review period, i.e.
- Stories – posts (or status updates) a user adds to their timeline;
- Engagements – interactions with a story, such as likes, comments or re-shares.
The strategic value of this data is enormous! For example, if as a result of working towards specific awareness or attitude objectives, Burberry manages to increase its share of engagement by a few percentage points, this will inevitably lead to more sales.
In that vein, if share of engagement is a proxy for share of voice in the digital age, we can’t fail to draw a parallel to the relationship between share of voice (SOV) and share of market (SOM), whereby research by the IPA (the Institute of Practitioners in Advertising) and Nielsen Analytic Consulting has found that the “average” campaign for an “average” brand that increased its share of voice by ten percentage points over and above its share of category sales, typically enjoyed an uptick of 0.5% in its total market share as a result.
This effect is further accelerated in the case of brand leaders, where a 10% “excess share of voice” delivers an extra 1.4 percentage points of market share, compared with an improvement of 0.4 percentage points for challenger brands.
The strategic value of using Facebook topic data as a diagnostic tool is even greater, as the share of engagement/share of voice concept can be applied on a market-by-market basis, thus helping brands to identify markets where competitors are underperforming in terms of engagement so as to attack their market share.
So the above chart, reconfigured for the Brazilian market, would look something like this:
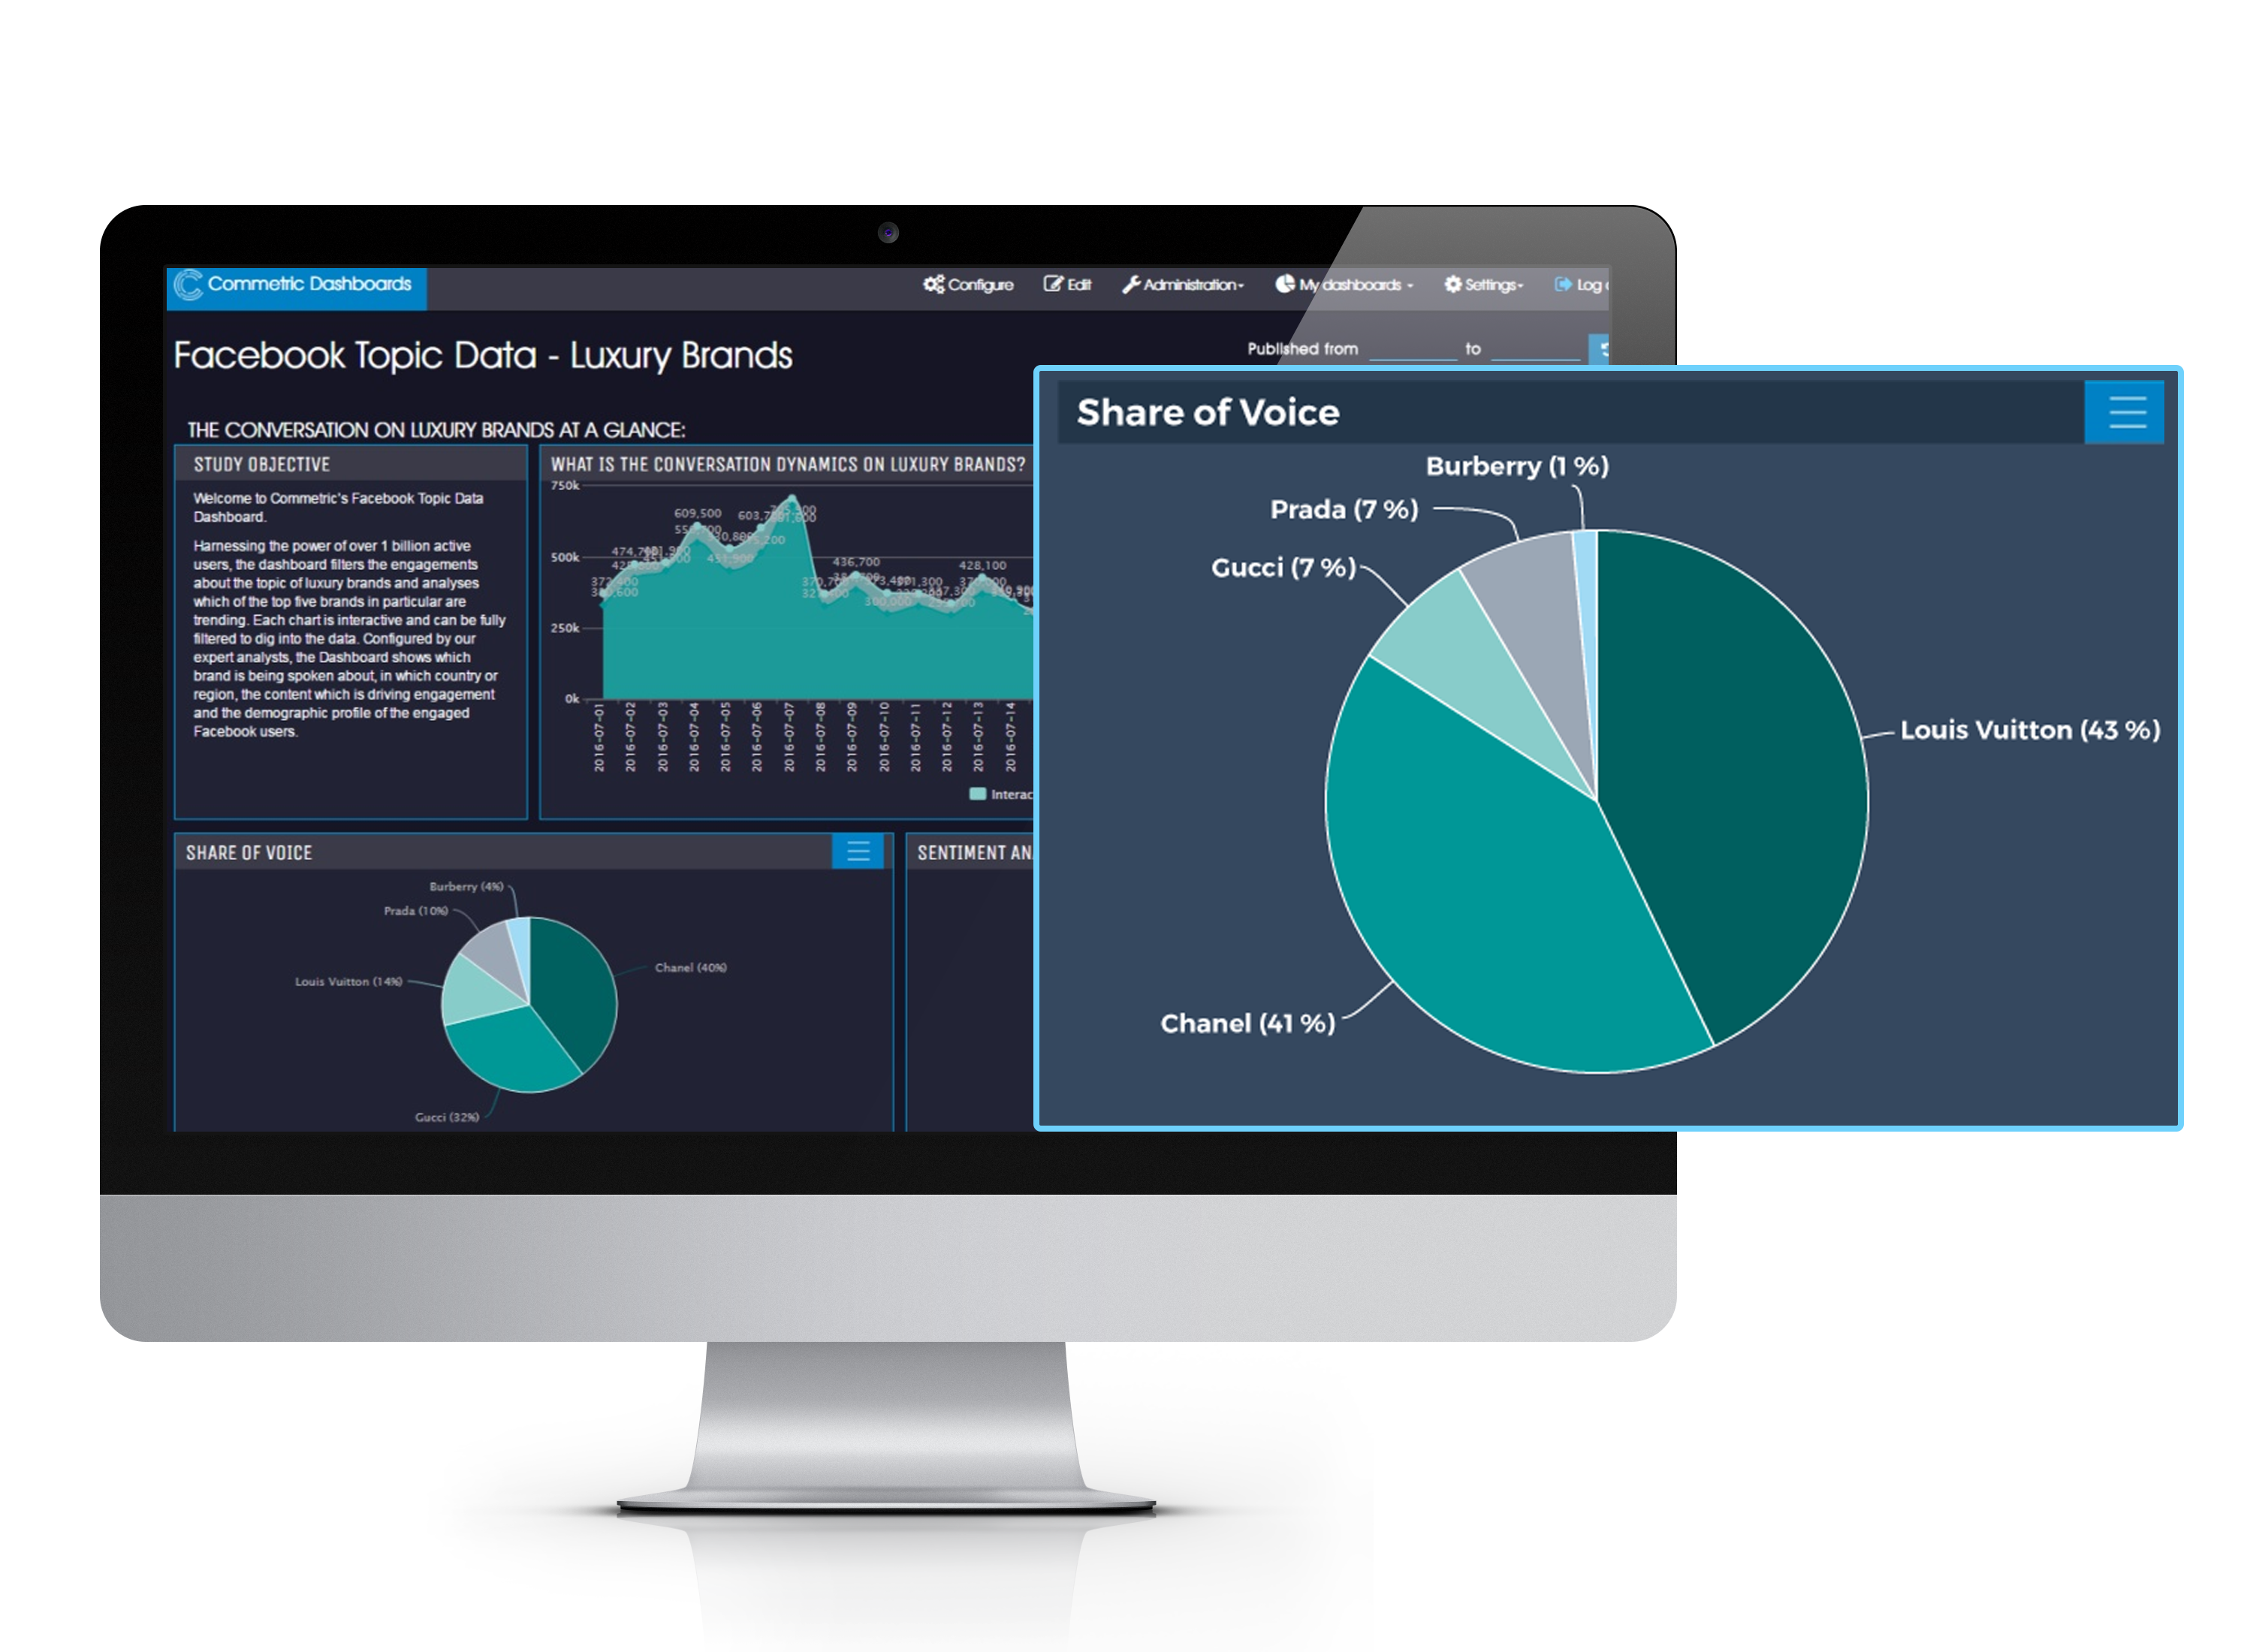
In Brazil, the global luxury market leader Louis Vuitton is leading the engagement game, and Gucci and Prada are clearly underperforming compared to their global share of engagement.
This perspective brings implications for social media marketing activities at a strategic level. Based on Schroer’s seminal article in Harvard Business Review “Ad Spending: Growing Market Share”, we can devise a strategic matrix showing how a brand’s social media marketing efforts on Facebook should be varied according to its share of engagement:
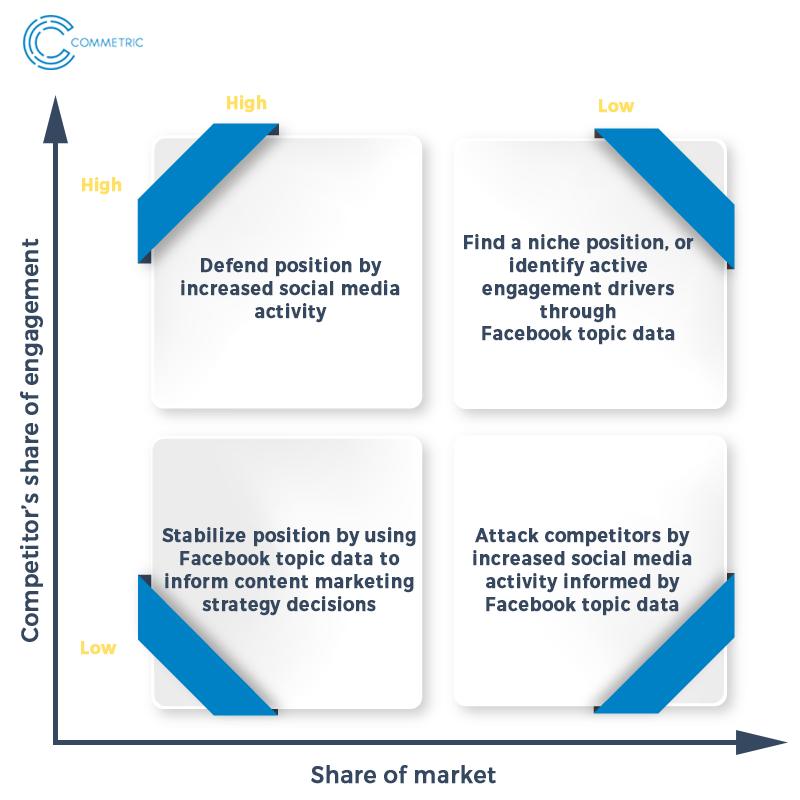
For example, based on its low share of engagement in Brazil and the high market share of competitors such as Louis Vuitton, Prada can use Facebook topic data to identify that its Brazilian audience’s most prominent perception of the brand is “iconic/timeless”, as opposed to “trendsetter” for Louis Vuitton, and thus tailor its content marketing and creative execution in Brazil around this pillar.